I read the monthly jobs report the way I read an open headcount requisition: scrutinizing the budget lines until the numbers reveal what the hiring committee is thinking. Total nonfarm payrolls, the count of jobs on employer payrolls outside farming, fell by 23,000 in July. The unemployment rate, the share of people who want work and looked for it but do not have a job, eased to 4.1 percent, according to the July Employment Situation from the Bureau of Labor Statistics. This is not a collapse. It is a small contraction after a run of shrinking gains. The interesting part is which departments lost funding.
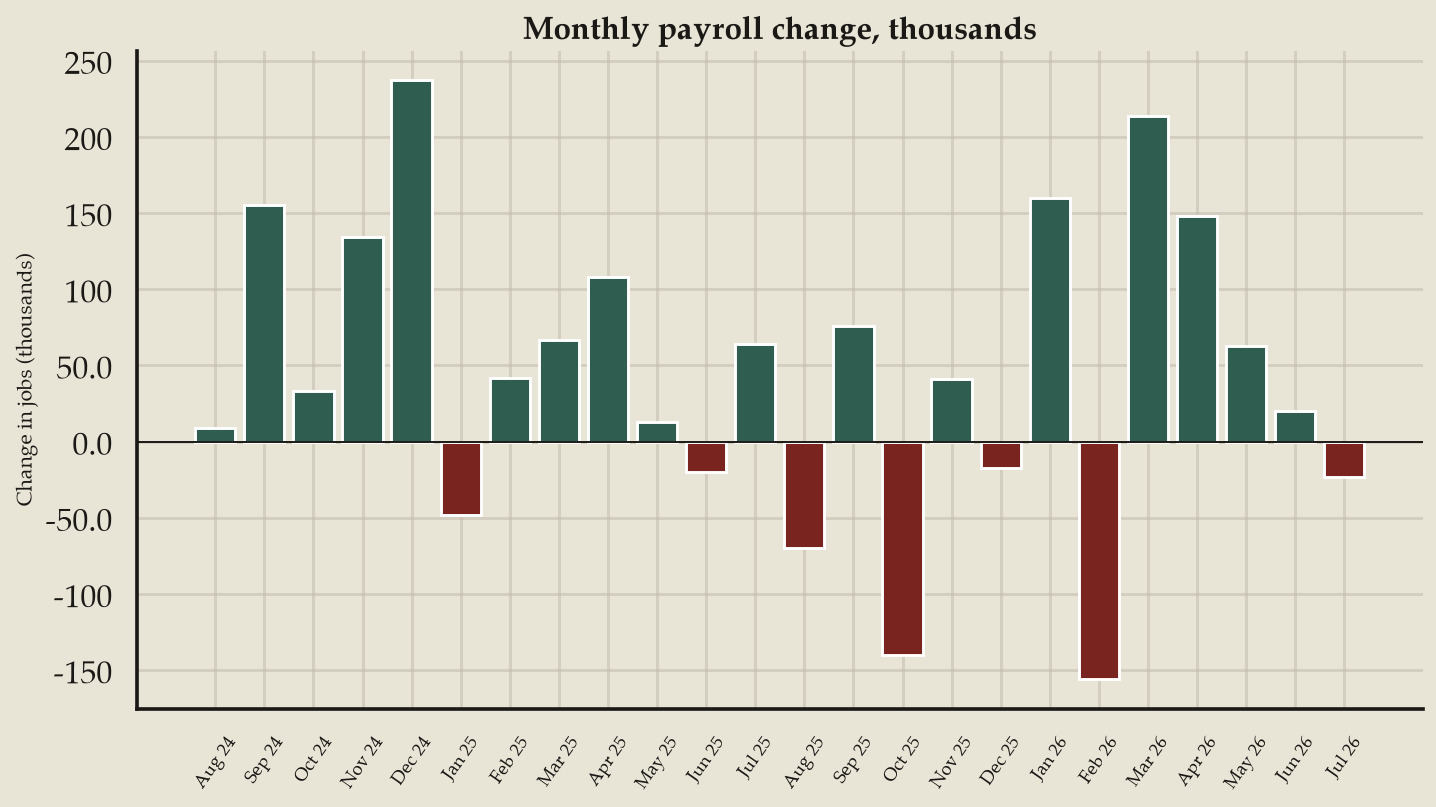
Read the chart like a shift roster. Over 24 months, 17 are green, meaning the economy added jobs. Seven are red. What changed is where those red months sit. Two losing months fall in the first year and five in the second, including a drop of about 156,000 in February 2026. The green bars have been shrinking since spring, showing how an approval queue dwindles when finance tightens purse strings. March 2026 added 214,000 jobs, April 148,000, May 63,000, and June a revised 20,000. July tipped below zero at minus 23,000. Seasonally adjusted means the Bureau removed normal summer and holiday swings.
The U.S. Economy at a Glance table puts this in numbers. Unemployment drifted down from 4.4 percent to 4.1 percent this year. The labor force participation rate, the share of adults working or looking for work, sat at 61.4 percent. The employment-population ratio, the share of adults who actually have a job, was 58.9 percent. A calmer jobless rate next to a flat participation rate does not mean recruiting sped up. It means fewer people were counted as looking.
The industries did the moving
The national total averages industries having very different months. Local government education lost 50,000 jobs in July. Retail trade lost 19,000. Financial activities slipped 14,000 and is down 121,000 since its May 2025 peak. Health care added 22,000, slower than a year earlier. Those figures come from the same establishment survey write-up as the headline. The establishment survey is the Bureau's count of jobs reported by employers, separate from the household survey producing the unemployment rate. I have signed that requisition. I know that an approved headcount represents a real seat at a real desk.
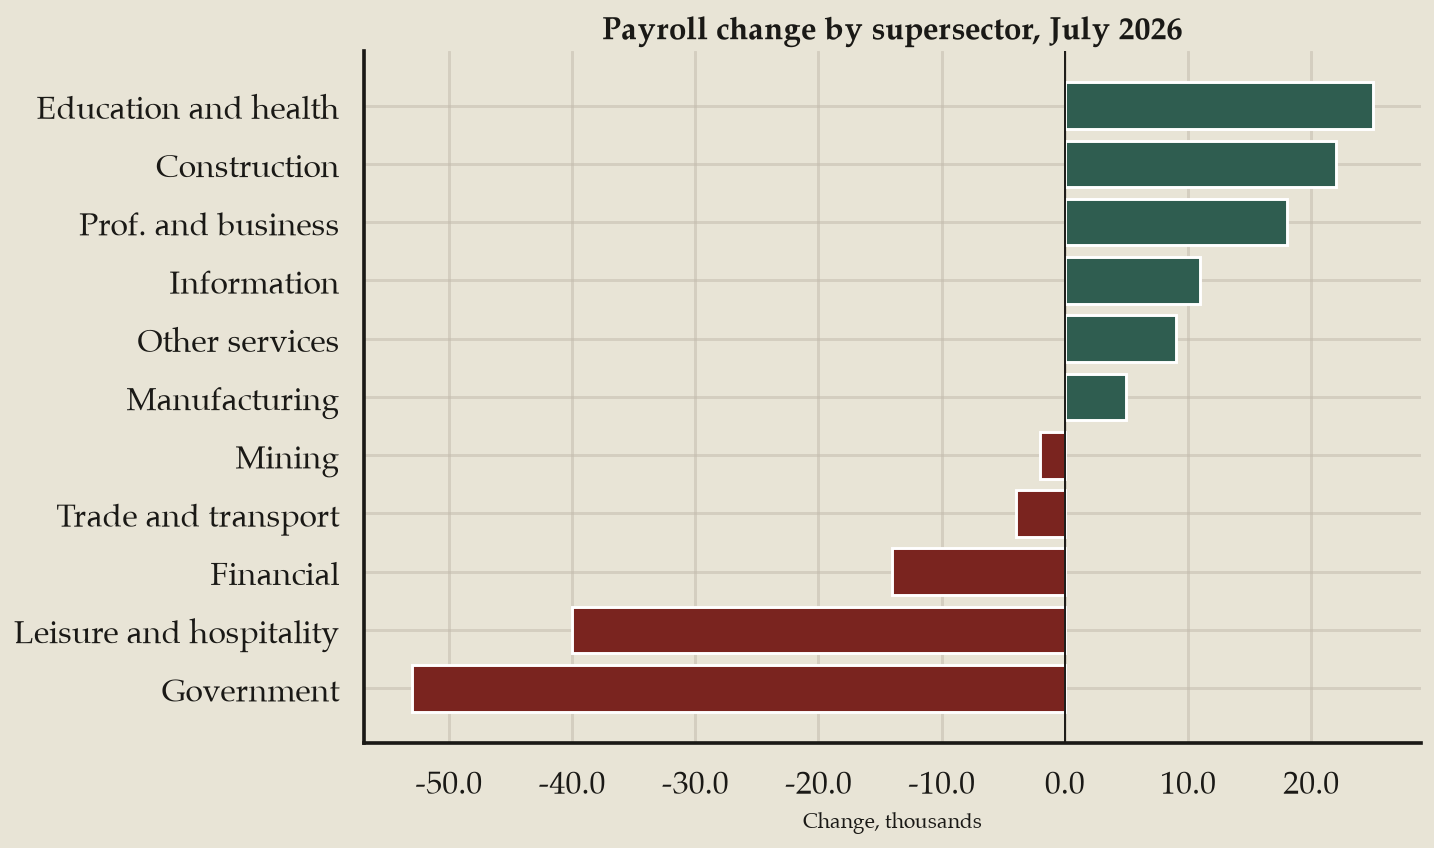
A supersector is the Bureau's name for a broad industry group. This chart sorts eleven of them from biggest gain to biggest loss. Six added jobs: education and health up 25,000, construction up 22,000, professional and business services up 18,000, information up 11,000, other services up 9,000, and manufacturing up 5,000. Five lost jobs: government down 53,000, leisure and hospitality down 40,000, financial activities down 14,000, trade and transportation down 4,000, and mining down 2,000. Retail sits inside that trade and transportation group. That is why a 19,000 retail loss appears as a short red bar instead of a long one.
If you work in a school district back office, July was a payroll shock with a government nametag. If you work in a clinic, your industry is still opening requisitions, just more slowly than last year. If you work in software adjacent information jobs, a gain of 11,000 is real but small. It operates as a floor, not a rebound.
One more number matters. May and June were revised down by a combined 103,000 jobs. A revision is the Bureau correcting an earlier month when late payroll records arrive, meaning spring was weaker than it first appeared. I have sat in that debrief. I know what a panel says after the candidate leaves the room when the budget suddenly looks shaky. Now the numbers show exactly why.
The weekly line is not panicking
Weekly claims tell you if people are actually being laid off this week. Initial claims are new applications for unemployment insurance, filed by people who just lost a job. For the week ending August 22, seasonally adjusted initial claims were 203,000, according to the Employment and Training Administration series published through FRED, the St. Louis Fed public data site.
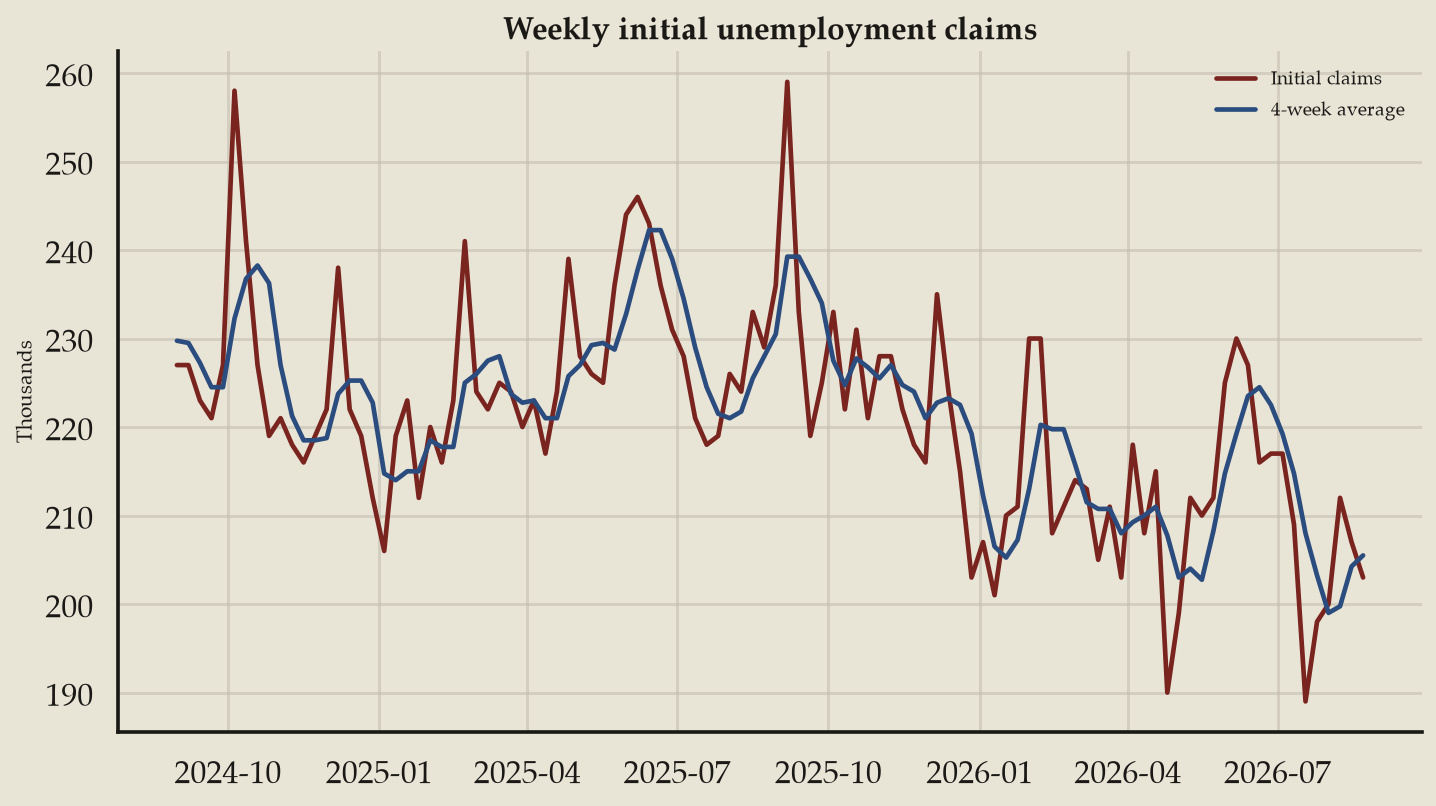
The red line is the raw weekly count. The blue line is the four week average, smoothing out one week jumps like the spikes to about 258,000 in October 2024 and about 259,000 in September 2025. In 2026 the weekly figure stayed between 190,000 and 230,000, below most of 2025. There was a bump toward 230,000 in June and a dip under 200,000 in late July before the latest 203,000. That is a low, jittery trend, not a rising one.
Continued claims, the number of people collecting unemployment insurance after their first week, sit near 1.78 million. Put both together and the situation is a hiring stall rather than a layoff wave. Employers are keeping current rosters intact and freezing open positions.
Average hourly earnings were $37.62 in July, up 2 cents on the month and 3.2 percent over the year. The average workweek held at 34.3 hours. Pay is inching up while hours are flat. Managing a department budget taught me this usually means employers would rather pay reliable staff a little more than risk the onboarding costs of adding another person.
What to do with a small, ugly print
Do not treat minus 23,000 as a verdict on your job search. Look at the budget reality of your own industry. The next Employment Situation lands Friday, September 4. Until then, the useful questions are local. Is your specialty in one of the six gaining sectors or the five shrinking ones? Are the recruiter emails in your inbox still turning into formal interviews? Did the last hiring manager you spoke with sound hurried or bored?
I will keep explaining how the employer side of the desk reads these reports. For now, look at your sector totals and the claims data. Then decide whether you should wait, move, or ask for more money while the room is still quiet enough to hear the answer.