
I pulled September 2026 data from the Employment Situation news release, the government monthly jobs report, to track unemployment by race. Staffing vendors profit when you trust blended numbers on the U.S. Economy at a Glance page, an official dashboard, ignoring how racial gaps reshape job search leverage.
Key takeaways
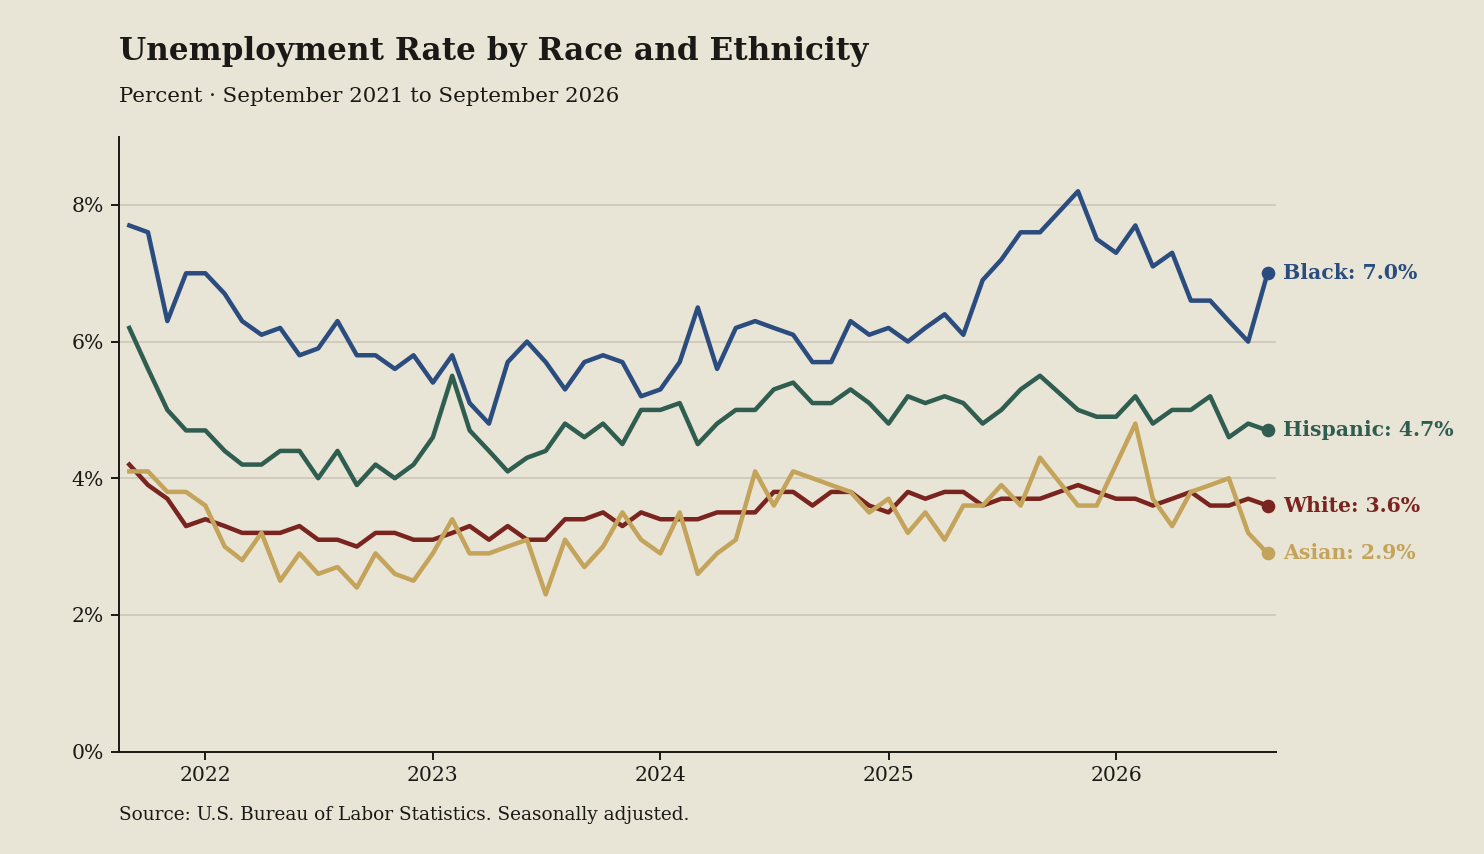
- Black joblessness (blue line) rose from 6.6 to 7 percent over four months, meaning these workers face stiffer application competition.
- White unemployment (dark red line) held flat at 3.6 percent over four readings, keeping hiring demand steady for these applicants.
- Hispanic unemployment (green line) fell from 5.2 to 4.7 percent across four months, signaling improving odds for active candidates.
- Asian joblessness (gold line) fell from 3.9 to 2.9 percent over four months, giving these candidates the strongest bargaining leverage.
What the terms mean
- The Current Population Survey household survey: A monthly federal poll of 60,000 homes measuring who has work.
- The Current Employment Statistics payroll survey: A monthly government count tracking nonfarm wage jobs through business records.
- Unemployment rate: The share of active job seekers who do not currently have paid employment.
What to watch next
Watch whether the Black jobless rate retreats from 7 percent, and never treat a headline 4.2 percent figure as everyone's reality.