
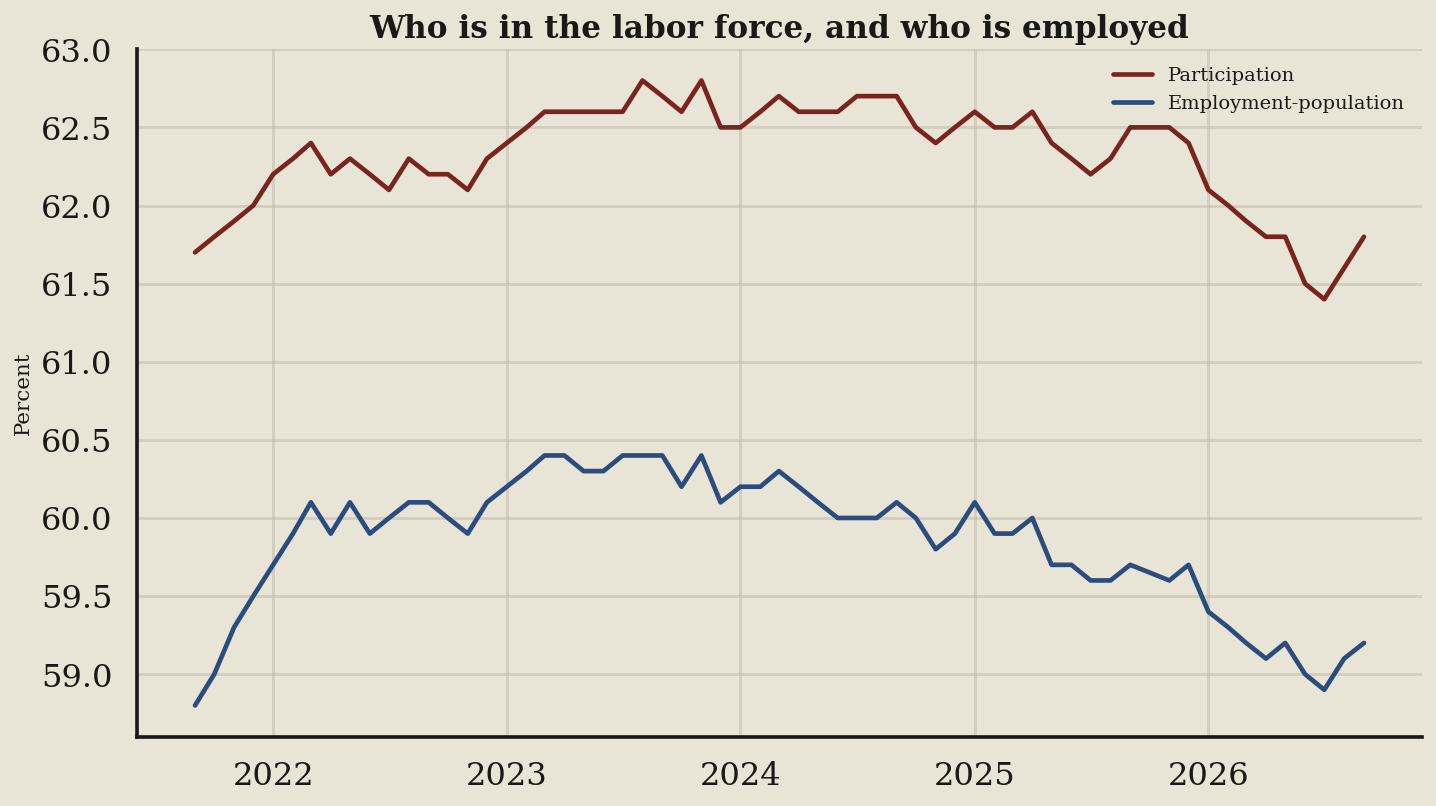
I pulled the Employment Situation news release, which draws on the Current Population Survey, a monthly household canvass, to plot participation against the employment-population ratio. Job seekers care because the labor force participation rate measures everyone actively seeking or holding work, while the employment-population ratio tracks who actually landed a paycheck.
Key takeaways
- The dark red participation line moved from 61.7 in September 2021 up to 61.8 percent, slightly expanding candidate supply.
- Participation fell from 62.8 percent in August 2023 to 61.4 in July 2026, showing candidate search fatigue before rebounding.
- Over the last four readings, the dark red line moved up from 61.5 to 61.8 percent, intensifying applicant competition.
- Over the last four readings, the blue line moved up from 59 to 59.2 percent, proving employers absorbed returning applicants.
What the terms mean
- Labor force participation rate: Share of adults working or seeking work, tracked in Federal Reserve records.
- Employment-population ratio: Proportion of the adult population currently employed, logged in Federal Reserve records.
- Current Population Survey: Monthly household survey measuring who is working, seeking work, or retired.
What to watch next
Watch whether falling participation creates an illusion of calm on the U.S. Economy at a Glance page while actual hiring freezes.