
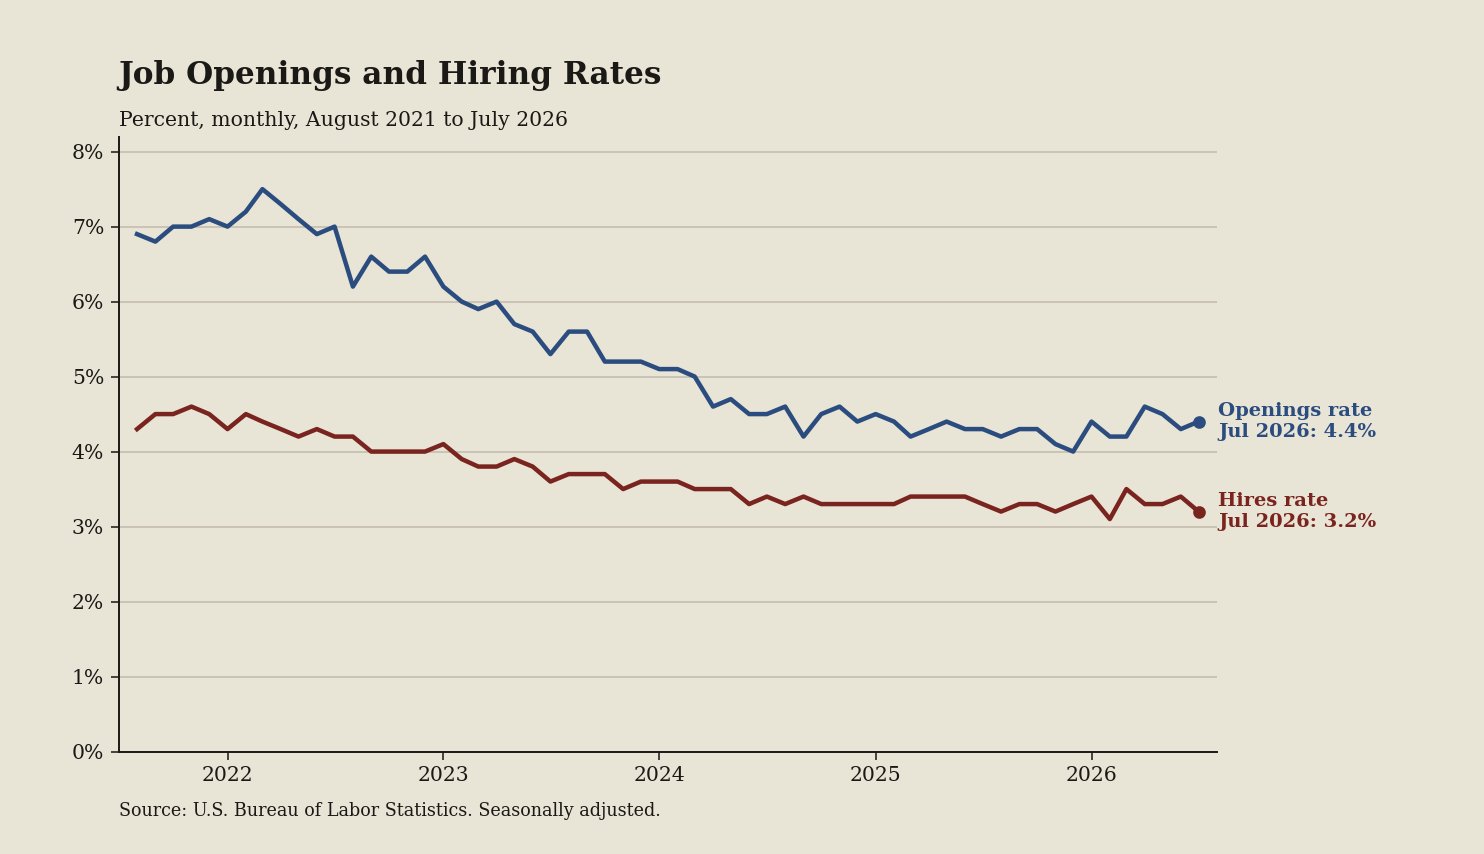
I pulled the Job Openings and Labor Turnover Survey news release, the federal report tracking vacancies and additions, to chart the openings rate against hires from August 2021 to July 2026. Comparing open positions as a share of total jobs against new workers hired warns job seekers that advertised listings often project growth without funding paychecks.
Key takeaways
- In the official hires data, the dark red line moved down from 3.3 to 3.2 over four readings, limiting job offers.
- In the official openings data, the blue line moved down from 4.6 to 4.4 over four readings, trimming advertised vacancies.
- On the U.S. Economy at a Glance summary, the dark red line dropped to 3.2, near its 3.1 low, slowing placements.
- The blue line openings rate dropped from its 7.5 high in March 2022 to 4.4, cooling competition for candidates.
What the terms mean
- Job Openings and Labor Turnover Survey: Monthly federal survey tracking vacancies, hires, and separations.
- Job openings rate: Unfilled positions on the last business day divided by employment plus openings.
- Hires rate: Workers hired during the month divided by total payroll employment.
What to watch next
When openings stay high and hires do not, treat postings as theater: recruiters and job boards get paid for traffic, not your offer letter.