
I pulled the federal jobs filing and labor dashboard. Vendors claim widespread slashing. Who profits from your panic? Career platforms. The Job Openings and Labor Turnover Survey, the federal tally of hires and separations, shows the truth. The layoffs and discharges rate, measuring the share of workers cut, proves firing is a slow drip, not a cliff.
Key takeaways
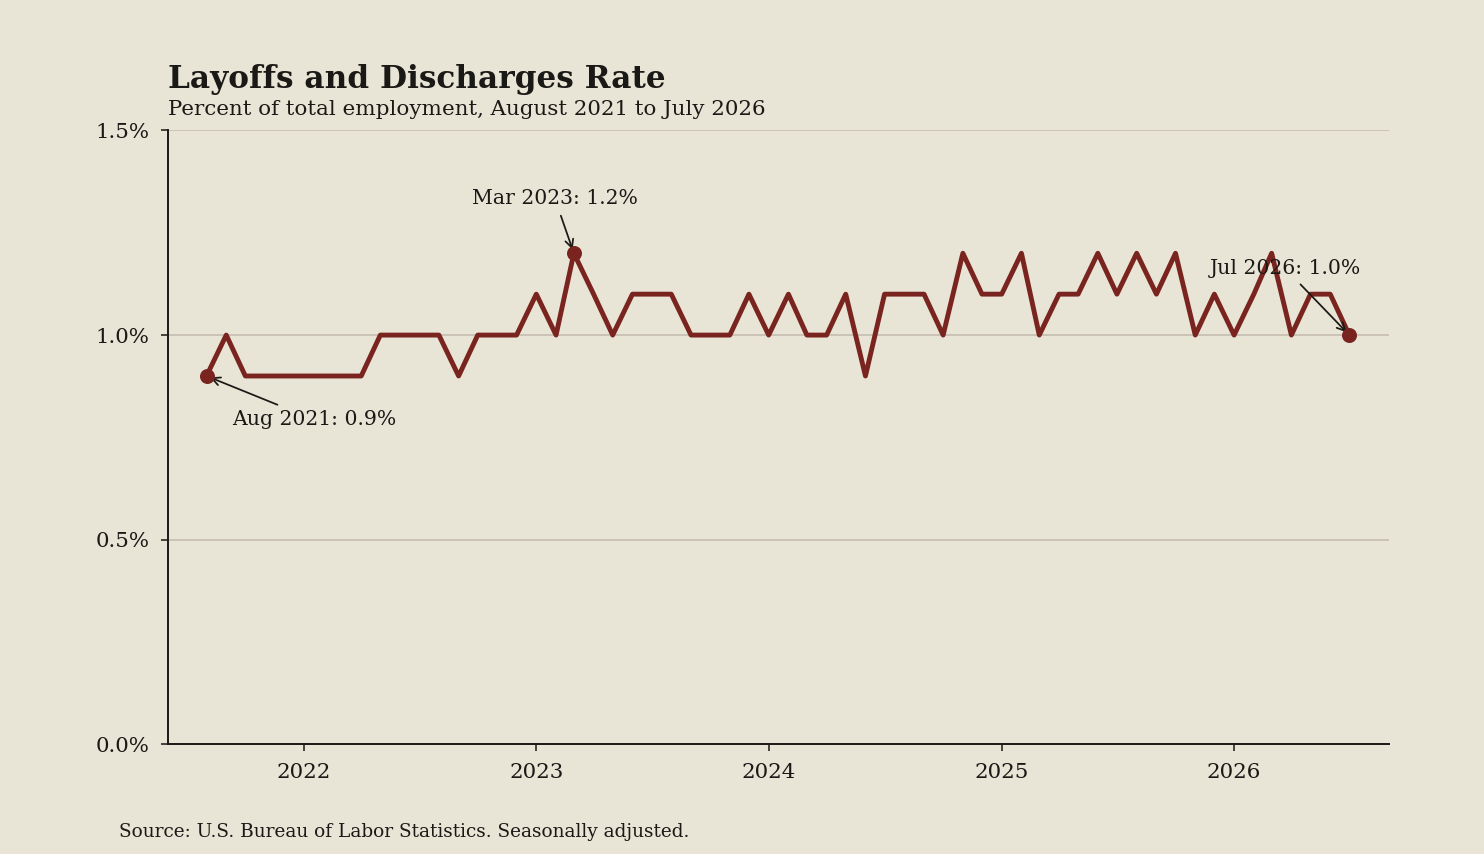
- The dark red line spans 60 monthly readings, starting at a 0.9 percent low in August 2021 to reveal peak worker leverage.
- It rose to a high of 1.2 percent in March 2023, showing when employers actively cut the most jobs.
- The rate ended at 1 percent in July 2026, meaning mass firings remain historically rare for active job seekers.
- Over the last four readings, the series moved roughly flat at 1 percent, signaling employers prefer freezing their current rosters.
What the terms mean
- The Job Openings and Labor Turnover Survey: The monthly federal tally of new hires, open roles, and separations.
- Layoffs and discharges rate: The share of total employed workers whom employers involuntarily cut during the month.
- Weekly claims: The federal tally of newly jobless workers filing for unemployment benefits.
What to watch next
Pair it with weekly claims, the count of newly jobless benefit seekers. If both stay low, the market stall is in hiring, not firing.