
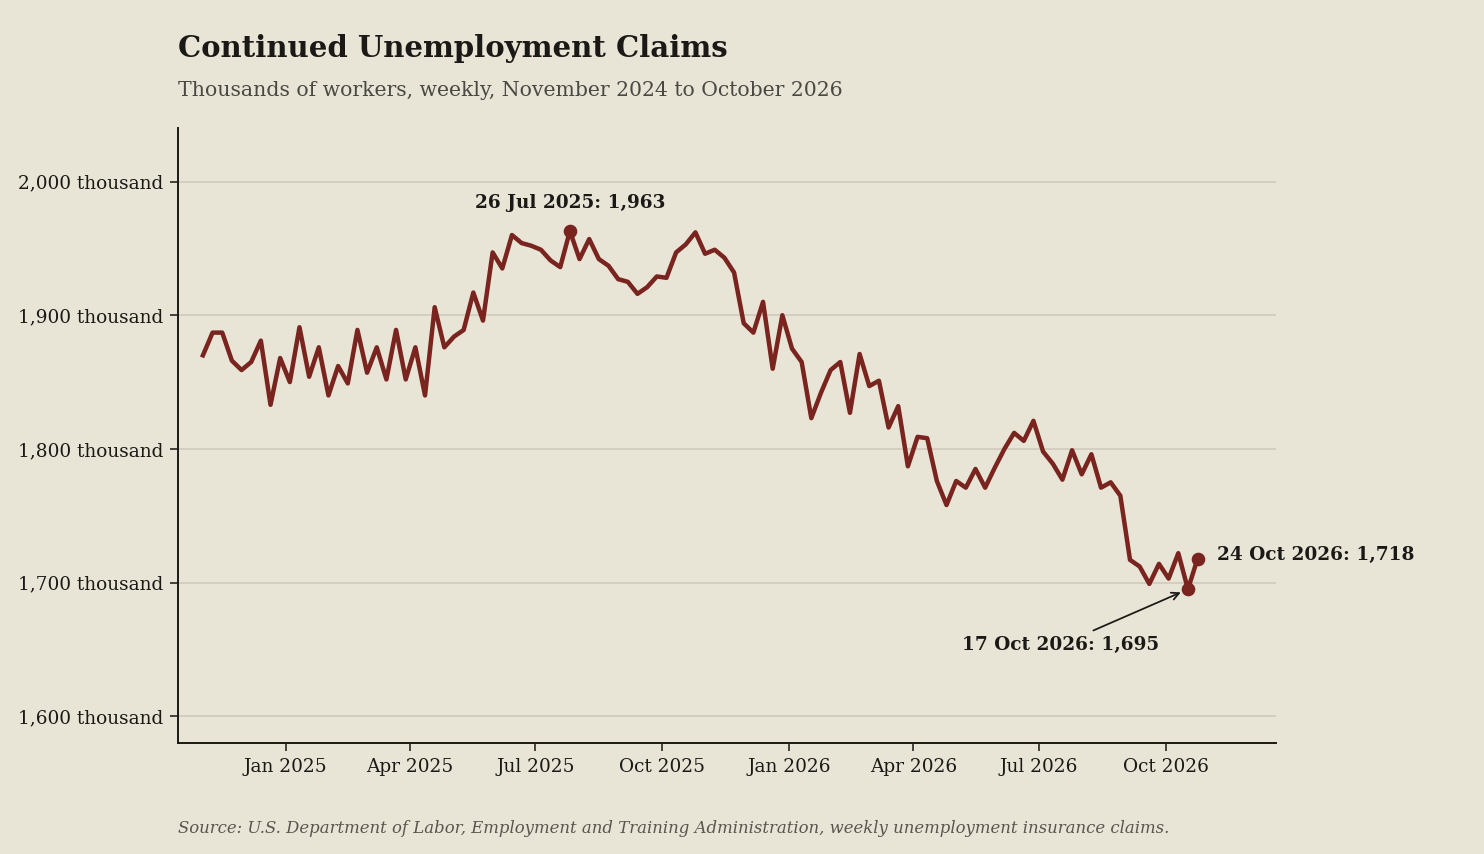
I pulled the Unemployment Insurance Weekly Claims Report to see how long layoffs drag on while the Employment Situation news release keeps headline unemployment flat at 4.1 percent. The dark red line plots the continued claims series, showing job seekers whether searches are stalling even as the U.S. Economy at a Glance table stays calm.
Key takeaways
- The dark red line fell from 1,870 thousand to 1,718 thousand across 104 readings, leaving fewer workers stuck on benefits.
- Continued claims hit a high of 1,963 thousand on 26 Jul 2025, when search durations peaked before easing.
- Claims reached a low of 1,695 thousand on 17 Oct 2026, marking the fastest exit from benefit rolls in two years.
- Over the last 4 readings claims moved up from 1,703 to 1,718 thousand, warning job seekers that rehiring has slowed.
What the terms mean
- Continued claims: Laid-off workers still collecting state unemployment benefits after their first week of joblessness.
- Initial claims: First-time filings submitted by workers who just lost their jobs to request unemployment benefits.
- The weekly claims report: The federal count of people receiving or filing for state unemployment benefits.
What to watch next
If the initial claims series stays quiet but continued claims rise, job searches are lasting longer.