
I pulled the data from the Employment Situation news release and the Table A-15 report, where the Current Population Survey, a federal household tally, compares headline jobless rate U-3 against broader underemployment gauge U-6. Staffing agencies profit when applicants believe hiring is effortless, but this wide gap proves real job competition remains stiff.
Key takeaways
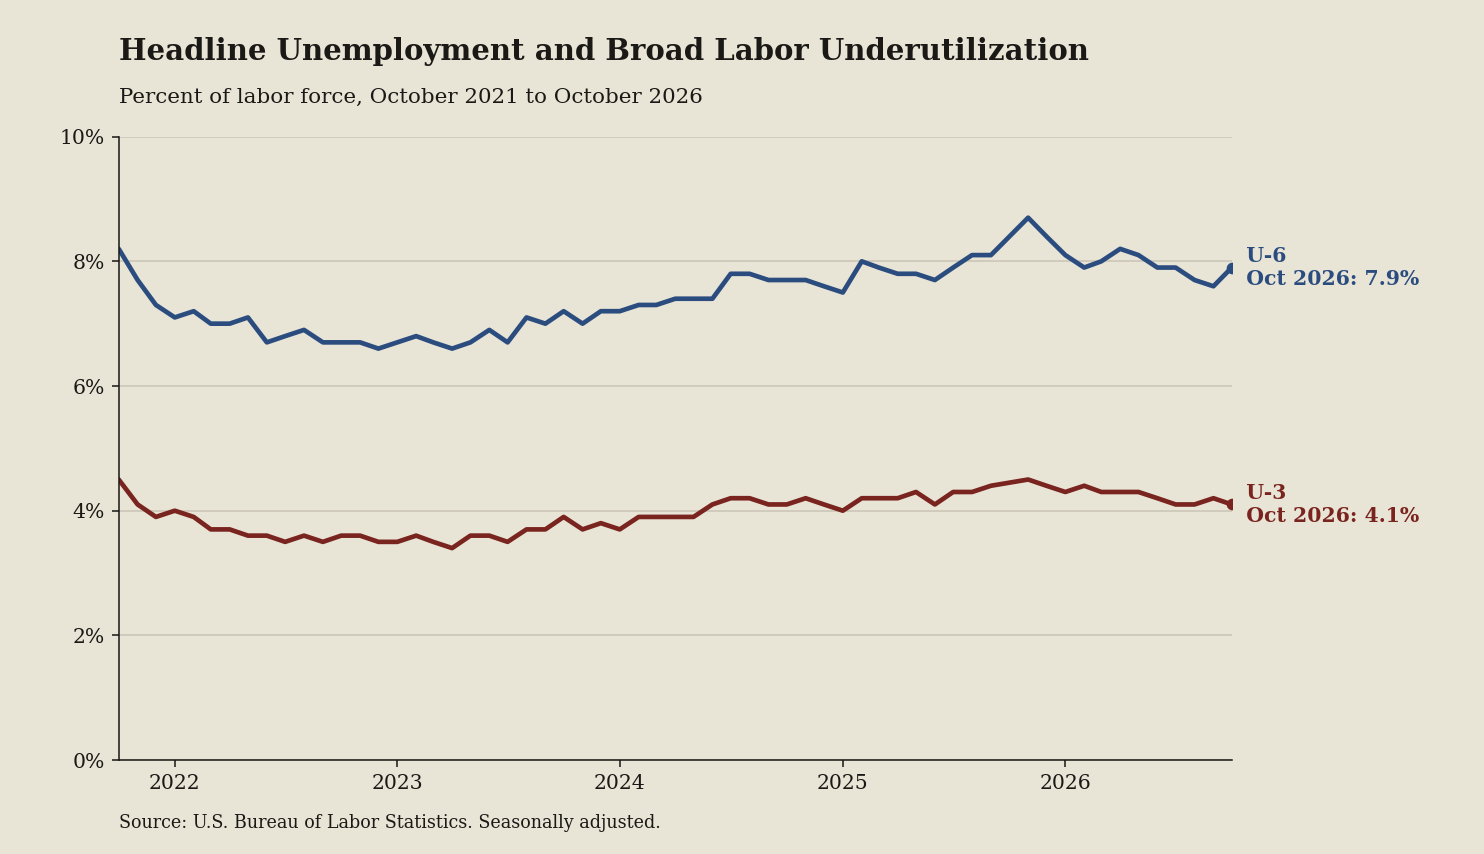
- The dark red line for U-3 held flat at 4.1 percent in October 2026, signaling headline job competition has stabilized.
- The blue line for U-6 held flat at 7.9 percent in October 2026, showing underemployed workers still seek full-time positions.
- Across 60 monthly readings, U-6 fell from an 8.7 percent peak in November 2025, easing peak underemployment for applicants.
- U-3 rose from its April 2023 low of 3.4 percent to 4.1, meaning hiring managers face less pressure to compete.
What the terms mean
- Current Population Survey: The monthly government household survey measuring national employment and labor force activity.
- U-3: The official rate measuring active job seekers without work as a share of the labor force.
- U-6: A broader rate tracked in the FRED U-6 series adding discouraged and involuntary part-time workers.
What to watch next
Watch whether headline unemployment on the U.S. Economy at a Glance page shrinks while U-6 stays sticky, signaling real applicant competition remains fierce.