
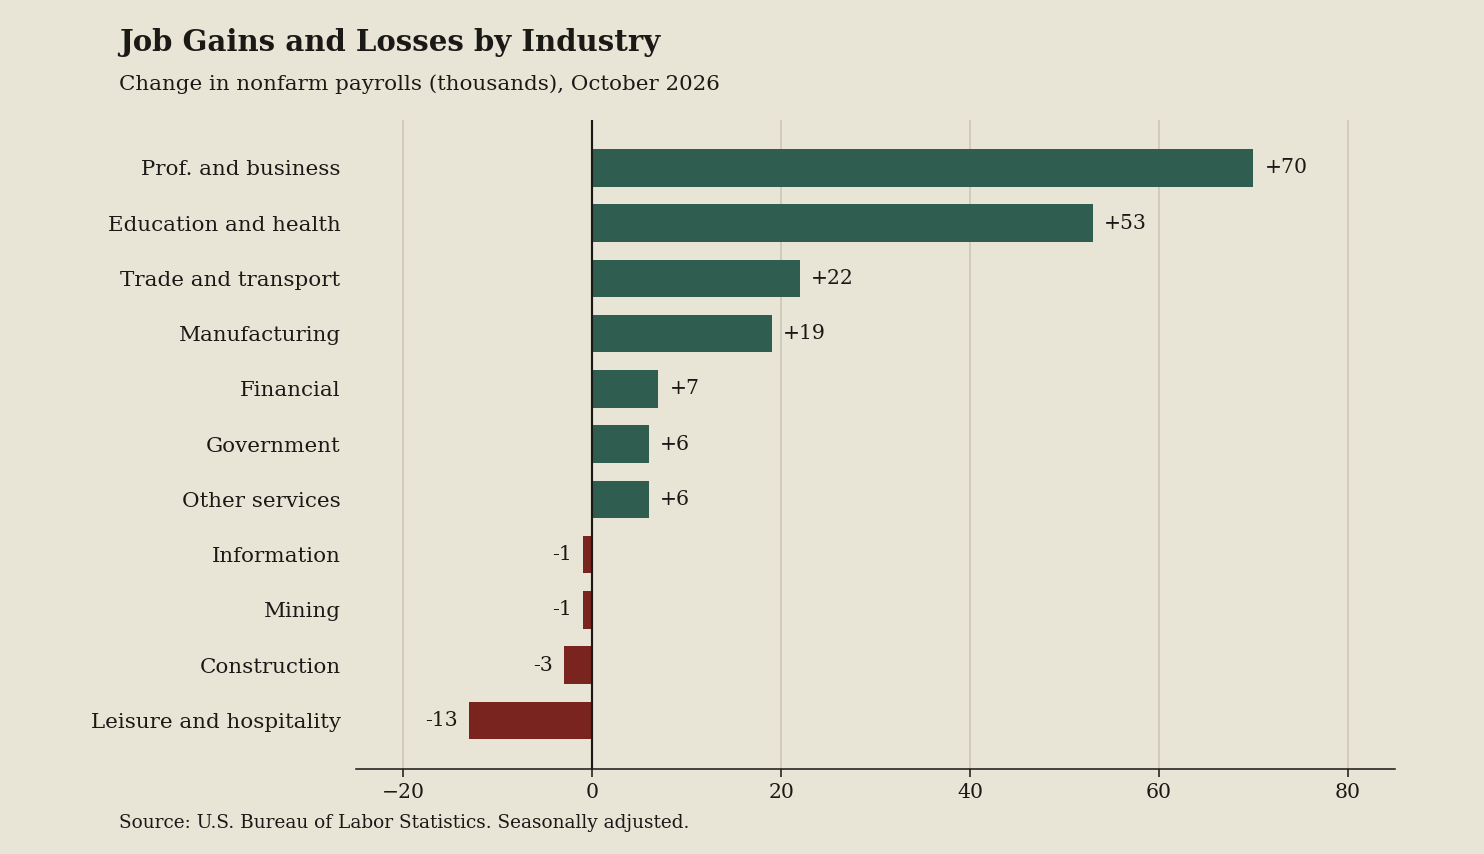
I pulled the Employment Situation news release, the government jobs report from the Current Employment Statistics program, which surveyed businesses and counted 165,000 added October 2026 payroll jobs. Recruiting platforms sell a nationwide boom, but the Table B-1 payroll breakdown splits eleven supersectors, or industry categories, proving leverage varies by field.
Key takeaways
- Professional and business services gained 70,000 jobs, leading all seven green bars and expanding corporate hiring capacity for white-collar applicants.
- Education and health added 53,000 positions, delivering steady interview opportunities for clinical workers despite broader hiring hesitations.
- Leisure and hospitality shed 13,000 jobs, marking the largest of four red bars and curbing openings for service candidates.
- Construction lost 3,000 jobs while Information dropped 1,000, signaling tightened requisition queues for skilled trades and media professionals.
What the terms mean
- Current Employment Statistics program: The monthly federal survey measuring wage and salary jobs from business records.
- The FRED nonfarm payrolls series: A monthly tally tracking paid U.S. workers, excluding agriculture.
- Supersector: A major industry group that combines related business activities to reveal broader employment patterns.
What to watch next
Consult the U.S. Economy at a Glance summary to check your supersector bar before assuming your field gained ground.