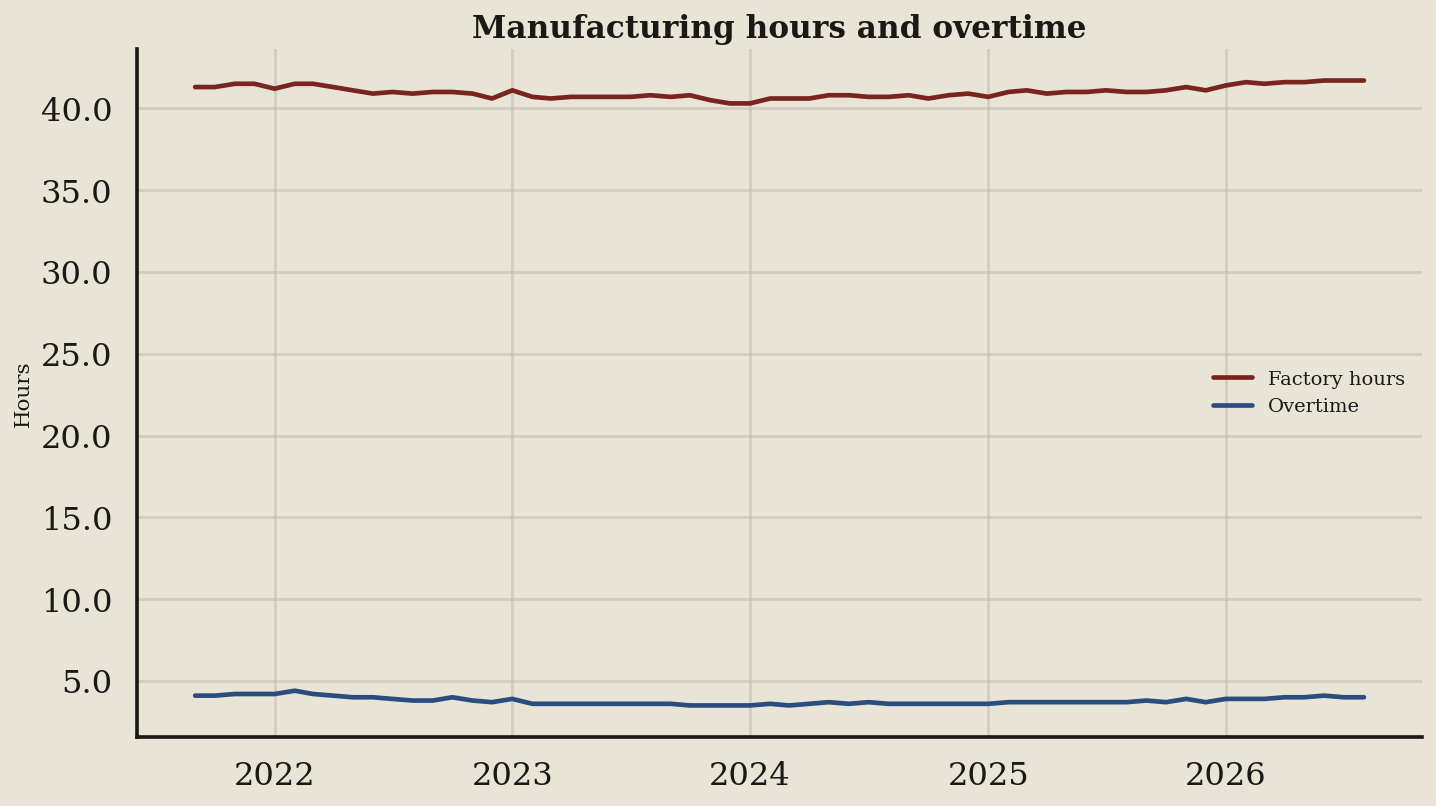
I pulled the Employment Situation report. Vendors sell a factory hiring boom, but the Current Employment Statistics program shows employers squeezing current crews. The chart tracks hours and official overtime numbers, proving this dimmer switch profits credential merchants, not job seekers.
Key takeaways
- Tracking 60 readings from September 2021 to August 2026, the dark red factory hours line started at 41.3 and ended at 41.7.
- Hours hit a 40.3 low in December 2023 and a 41.7 high in June 2026, proving managers prefer current staff over hiring.
- Over the last four readings, hours moved up from 41.6 to 41.7, confirming management's tight grip on factory payrolls.
- The blue overtime line started at 4.1, peaked at 4.4 in February 2022, and hit a 3.5 low in October 2023.
- Overtime ended roughly flat at 4 over the last four readings, warning candidates that managers dial down extra shifts before firing.
What the terms mean
- The Employment Situation report: the monthly federal jobs release that combines household and employer surveys to measure labor health.
- The Current Employment Statistics program: the official government payroll survey that provides the hours and overtime data shown above.
- U.S. Economy at a Glance: a federal summary page that tracks top-level indicators like unemployment and payroll changes.
What to watch next
Check U.S. Economy at a Glance next month, because overtime fading is cheaper than a layoff and usually arrives earlier.