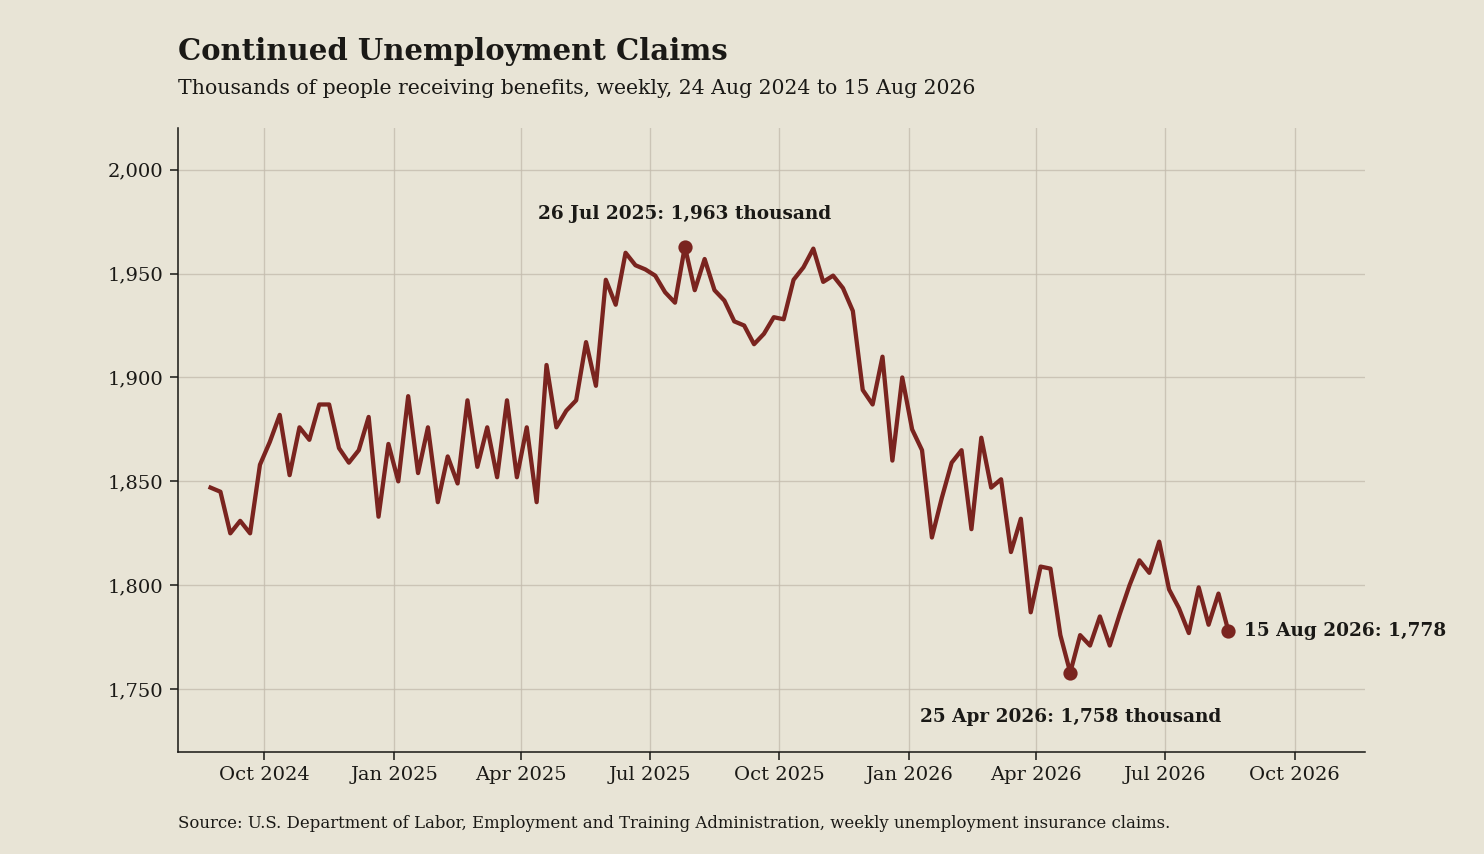
I pulled the administrative filings for July 2026, and the headline numbers hide the reality of the street. The chart below tracks how many people are still drawing unemployment checks after their first week. If you are looking for work, this reading tells you exactly how long a layoff actually lasts. It strips away the optimistic projections and leaves you with the bare math of job market friction.

Line chart: Continued claims show how long a layoff still lasts (July 2026 data)
Source: U.S. Bureau of Labor Statistics public data API and, for weekly claims, the Employment and Training Administration via FRED. Seasonally adjusted where the source publishes it that way. Chart drawn by the PorkiMail data desk.

What the chart shows

The vendor copy for the job market says everything is fine. The official documentation says something else. The latest reading for Continued Claims sits at 1,778,000. This series counts the people who have already cleared the first week of a layoff and remain on unemployment insurance. We also track Initial Claims, which measures the newly unemployed. New filings have been relatively quiet, meaning employers are not conducting massive layoffs. But the steady rise in the continuing count means those who do lose their jobs are not finding a quick exit. When you match this up with the broader Employment Situation news release, which recently pegged the official unemployment rate at 4.1 percent, the picture snaps into focus. Hiring managers are dragging their feet.

What the terms mean

Let us translate the bureaucratic jargon into plain English. The definitions below cover every statistical concept I pulled for this note. Because this specific chart relies on a direct count of state administrative records, there is no underlying survey name to include for the claims data.

  • Continued Claims: A weekly count of people who previously filed an initial claim, experienced a full week of unemployment, and filed again to keep receiving benefits. This is a direct measure of how hard it is to land a new role.
  • Initial Claims: The number of people filing for unemployment insurance for the very first time after losing a job. It is a proxy for the pace of new layoffs.
  • Employment Situation news release: The monthly government report that gives us the official unemployment rate and counts how many jobs were added or lost across the country. The unemployment rate specifically comes from the Current Population Survey, which polls households directly.
  • Seasonally adjusted: A statistical math trick that removes predictable seasonal changes, like holiday retail hiring or summer agricultural work, so we can see the real underlying trend in the numbers. All the figures in this note use this adjustment.
  • U-3: This is the official unemployment rate, currently sitting at 4.1 percent. It measures the share of the labor force that has no job but has actively looked for work in the past four weeks.
  • U.S. Economy at a Glance: A summary dashboard maintained by the government that collects major economic indicators, like inflation and unemployment rates, in one place. I use it to verify the broader trends.

Why it matters if you are looking for work

Follow the incentive. Employers do not benefit from rushing to hire when they know candidates have fewer options. The longer this specific line in the data stays elevated, the more leverage hiring managers hold. If you believe the marketing copy that says tech talent is still flying off the shelves, you are the mark. The numbers prove the friction is real. Candidates who expect a three-week interview process are finding themselves in month three of a search. Employers can afford to leave job postings open, run candidates through six rounds of interviews, and wait for a perfect match. You need to budget your savings and your sanity for a marathon, not a sprint. Do not rely on one lead to close. Protect your downside and assume every hiring process will take twice as long as the recruiter claims.

What to watch next

If new layoffs stay low but this continuing count keeps climbing, you know the hiring freeze is deepening. Keep your eye on the gap between the initial shock of job loss and the time spent waiting for a new offer. Does this trend break before the fourth quarter, or are longer searches the new normal? Until the continuing line starts to drop, expect employers to hold the leverage.