
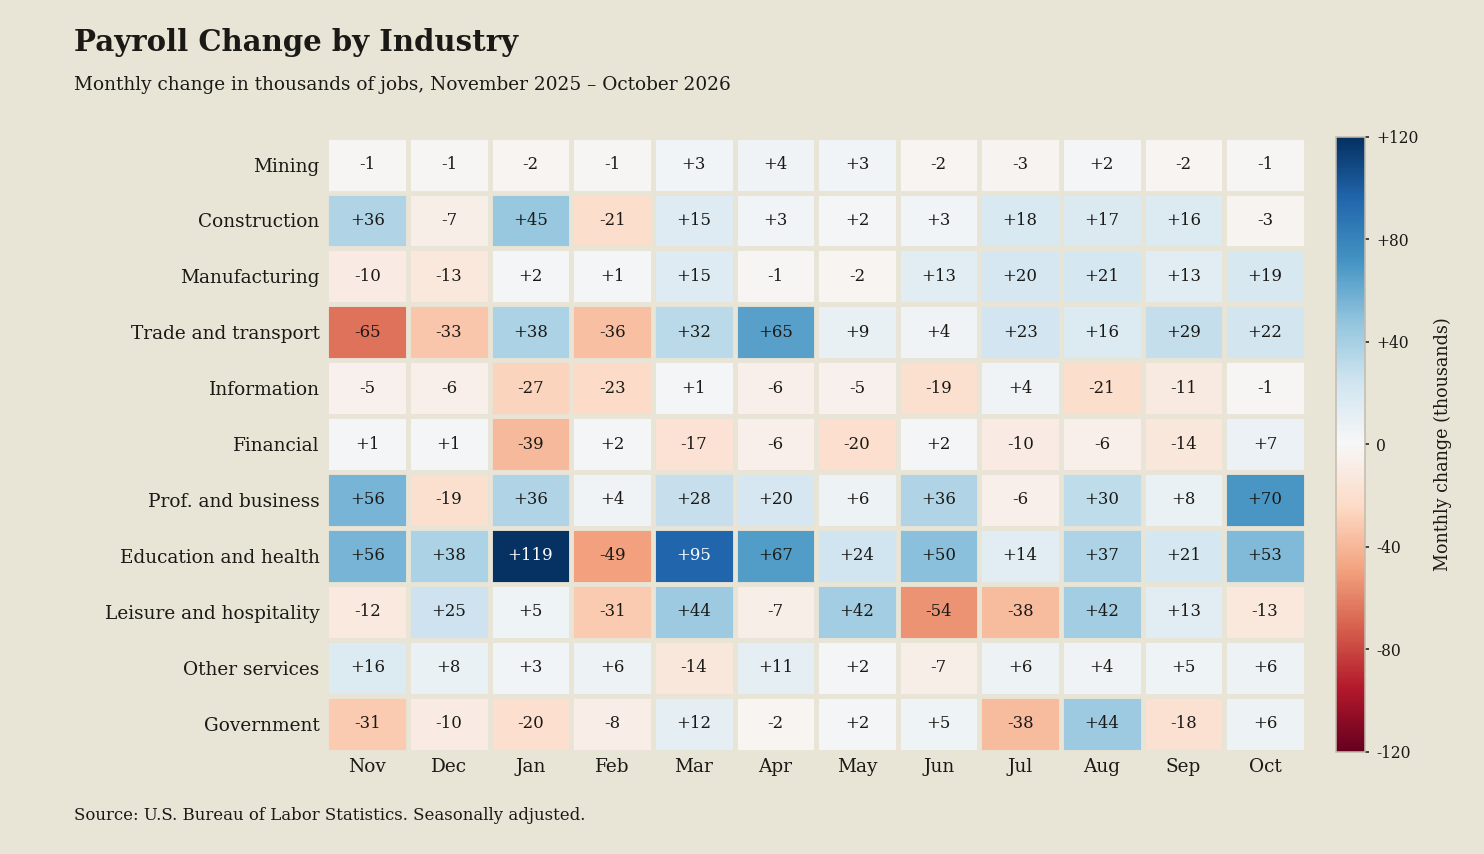
I pulled seasonally adjusted nonfarm payrolls, which remove routine calendar swings to count employer jobs, from the Current Employment Statistics program in the Employment Situation news release. This 12-month heatmap across 11 sectors from November to October proves hiring leverage varies by industry, not national sentiment.
Key takeaways
- Information logged the most red cells at 10 of 12 months, signaling persistent contraction that severely restricts tech job applicant leverage.
- Education and health generated the largest gain at +119 thousand in January, offering applicants the strongest hiring expansion.
- Trade and transport suffered the largest loss at -65 thousand in November, warning logistics job seekers of steep seasonal cuts.
- Mining, Construction, Information, and Leisure and hospitality turned red in October, signaling immediate job losses that freeze applicant bargaining power.
What the terms mean
- The Current Employment Statistics program: A monthly federal employer survey tracking nationwide industry job gains and losses.
- Nonfarm payrolls: The net count of wage and salary workers tracked in the FRED nonfarm payrolls series.
- Seasonally adjusted: Data on the U.S. Economy at a Glance page filtered to remove predictable calendar fluctuations.
What to watch next
Watch for any industry column that stays red next month, signaling a lane going cold rather than normal statistical noise.