
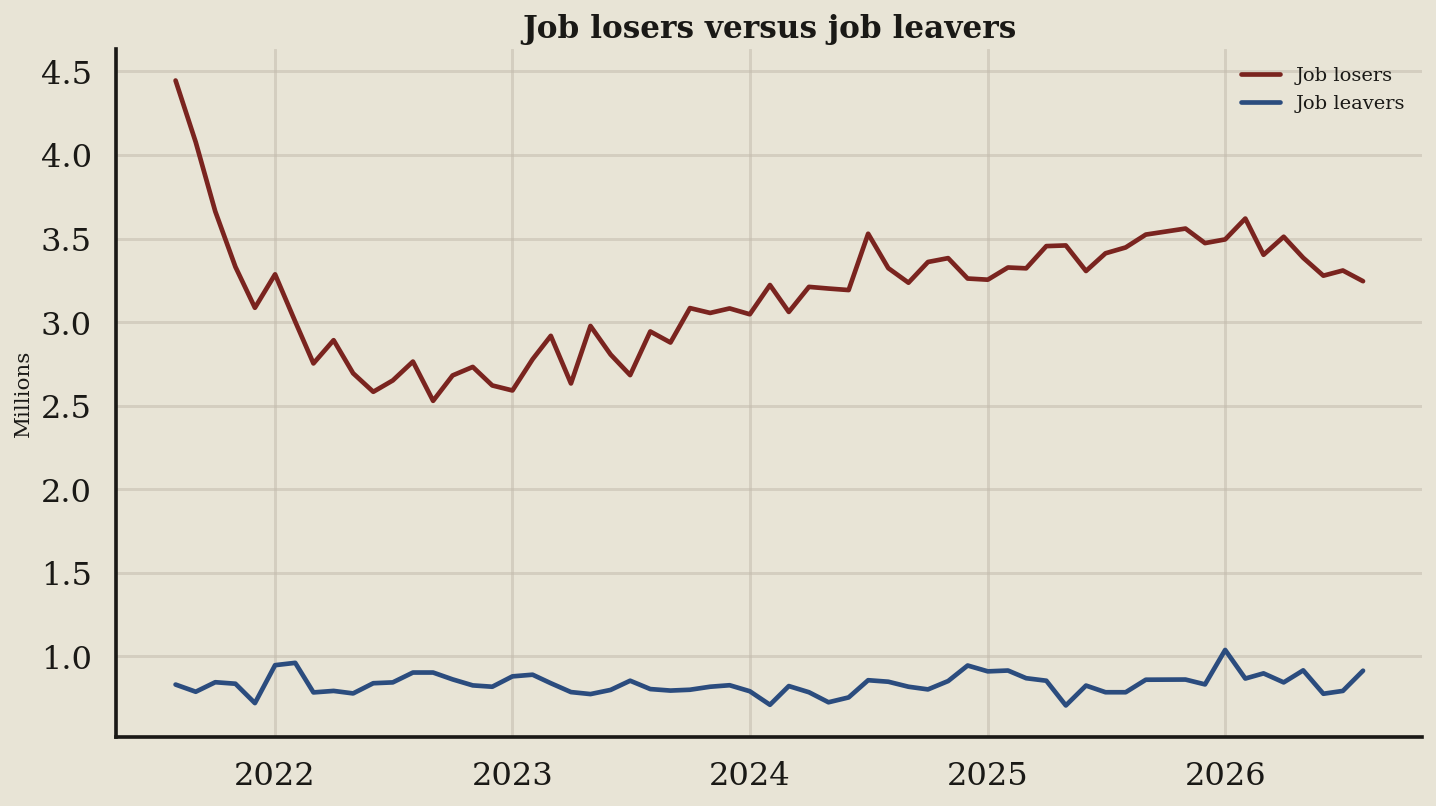
Resume vendors only get paid if you believe candidates hold the leverage, so I pulled the August 2026 filing from the Employment Situation report to check the receipts. The chart maps 60 months of data, proving that with 3.2 million job losers (laid-off workers) against just 0.91 million job leavers (voluntary quits), employers dictate your search.
Key takeaways
- The dark red line dropped from a 4.4 million high to 3.2 million job losers, meaning forced exits flood the market.
- Over the last four readings, job losers moved down from 3.4 million to 3.2 million, signaling a fractional drop in layoffs.
- The blue line for job leavers peaked at 1.0 million in January 2026 before dropping to 0.91 million, indicating evaporating confidence.
- Job leavers moved roughly flat from 0.92 million to 0.91 million over four readings, proving employed workers are stalling turnover.
What the terms mean
- the Employment Situation report: The primary government survey counting national unemployment and job creation.
- Job losers: Workers who were fired or laid off, forming the bulk of the newly unemployed.
- Job leavers: Workers who voluntarily quit, usually a signal of confidence in landing a new role.
What to watch next
Losers rising while leavers fall is a market that got less choosy, meaning you must watch whether employers keep dictating lower pay.