
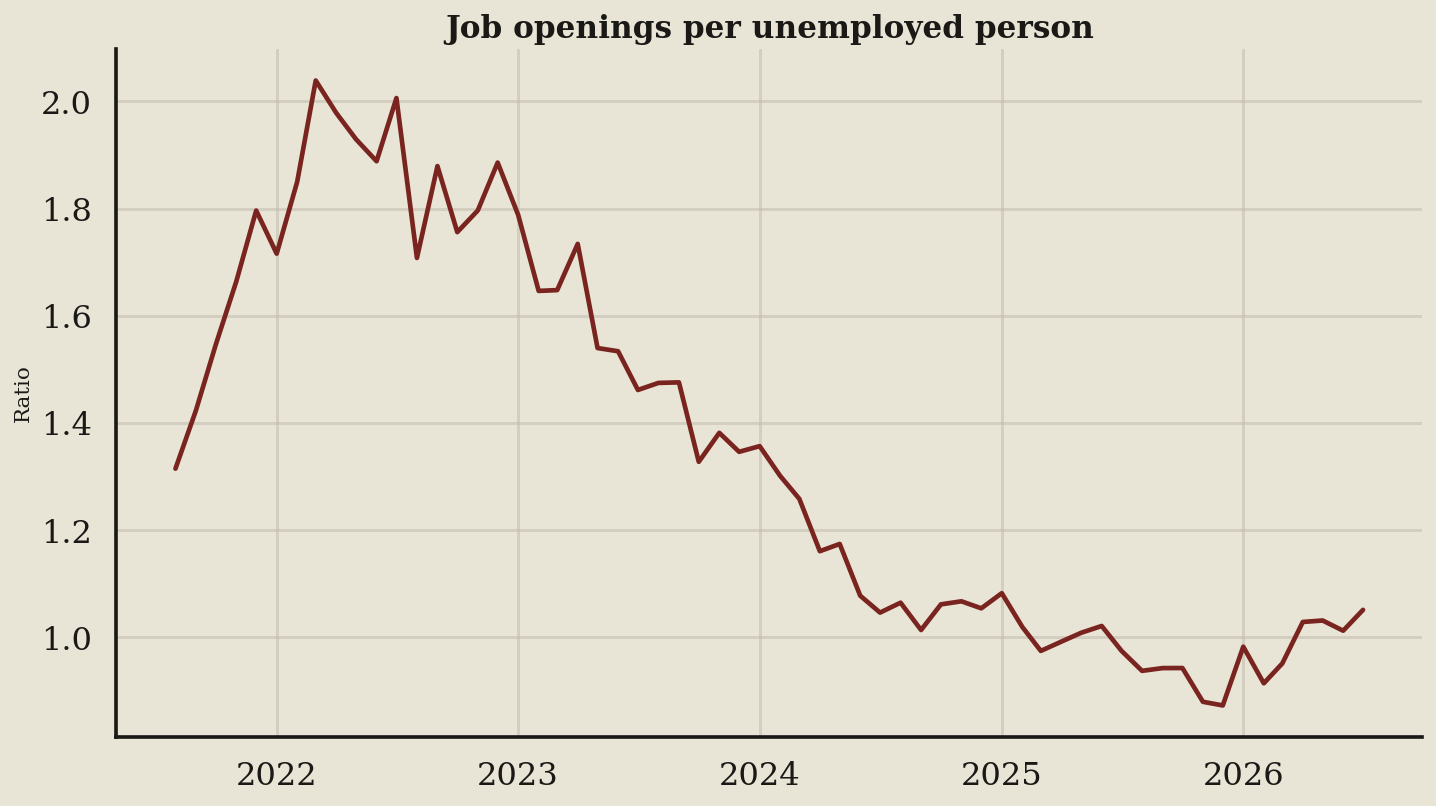
I pulled the data from the Job Openings and Labor Turnover Survey news release, the federal report counting unfilled jobs across the economy. The chart tracks a crude bargaining-power ratio of job openings per unemployed person, and its latest 1.051 reading proves that hiring leverage has returned to employers.
Key takeaways
- The five-year slide: The 60-month window opened at 1.3 in August 2021 and ended at 1.1, bleeding away worker momentum.
- Peak leverage: The dark red line hit a high of 2.0 in March 2022, when job seekers could name their price.
- Leverage bottom: The ratio dropped to a low of 0.87 in December 2025, meaning employers had zero reason to rush hires.
- Stagnant present: Over the last four readings, the line moved roughly flat between 1.0 and 1.1, signaling a frozen hiring market.
What the terms mean
- Unemployed: People without work who are actively looking, measured by the Employment Situation report.
- Job openings: Unfilled positions employers are trying to staff, tracked by the Job Openings and Labor Turnover Survey.
- Ratio: Openings divided by the jobless total, found on the U.S. Economy at a Glance page.
What to watch next
When the ratio falls, employers can wait. Workers cannot.