
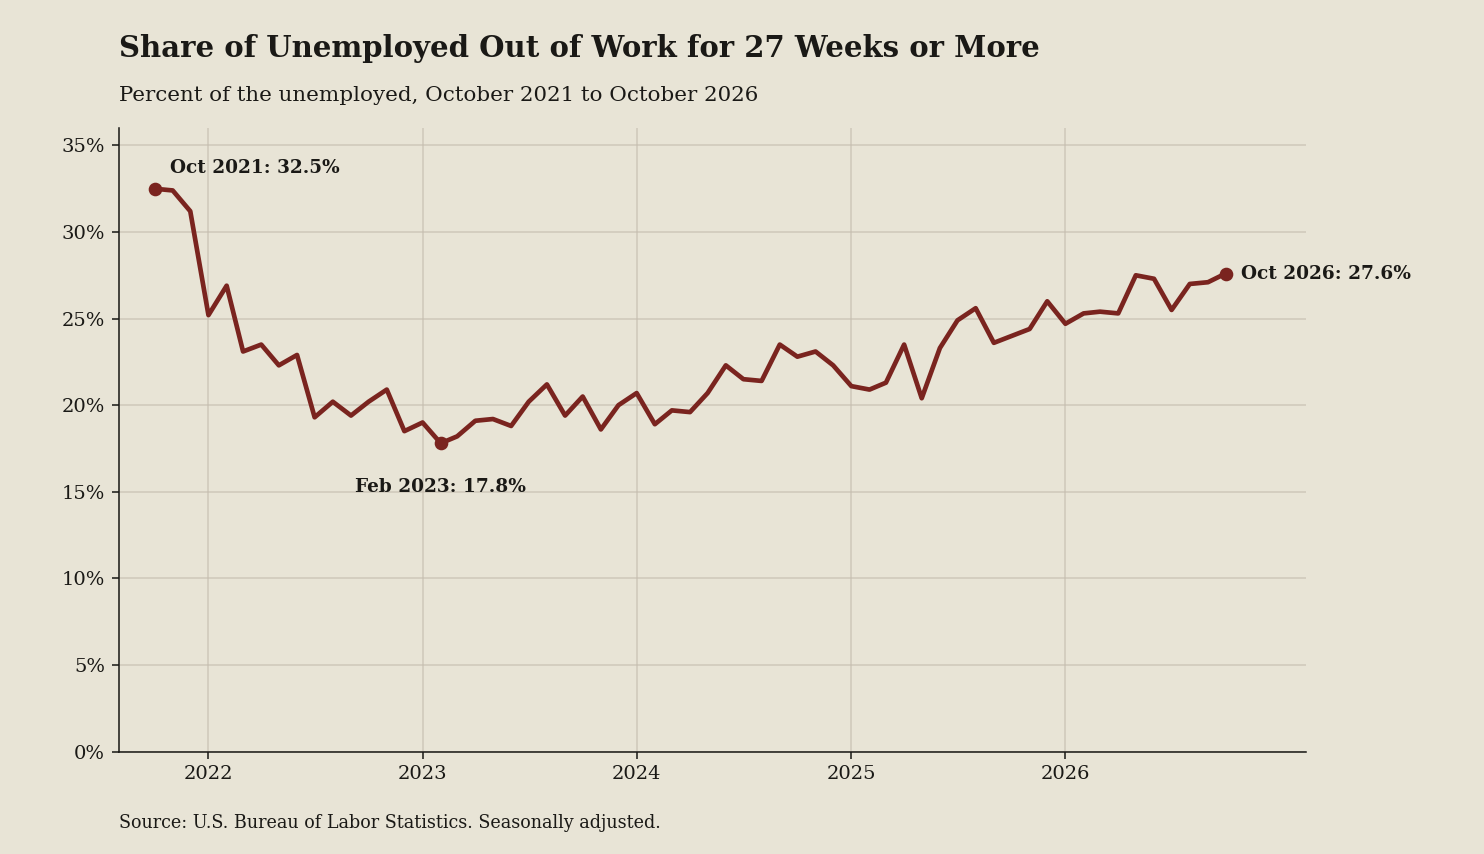
I pulled the Employment Situation news release, the monthly jobs report, where the dark red line shows the share jobless 27 weeks or more reached 27.6 percent. While hiring numbers in the Current Employment Statistics program, the government payroll survey, appear steady, this climb means job searches are quietly stalling.
Key takeaways
- Over the last four readings, the share moved up from 25.5 to 27.6 percent in FRED duration data, signaling queues are lengthening.
- The dark red line climbed from its low of 17.8 percent in February 2023, showing employer urgency has steadily cooled.
- Across 60 monthly readings, the dark red line fell from 32.5 to 27.6 percent, keeping overall applicant competition fierce.
What the terms mean
- The Current Population Survey: The monthly household survey measuring employment status and how long job searches last.
- The Current Employment Statistics program: The monthly business survey tracking nonfarm payroll jobs and industry employment levels.
- Long-term unemployed: Jobless workers who have been actively seeking employment for 27 weeks or longer.
What to watch next
Watch whether the 1,951,000 long-term unemployed count in the U.S. Economy at a Glance table expands, signaling that search queues are stacking.