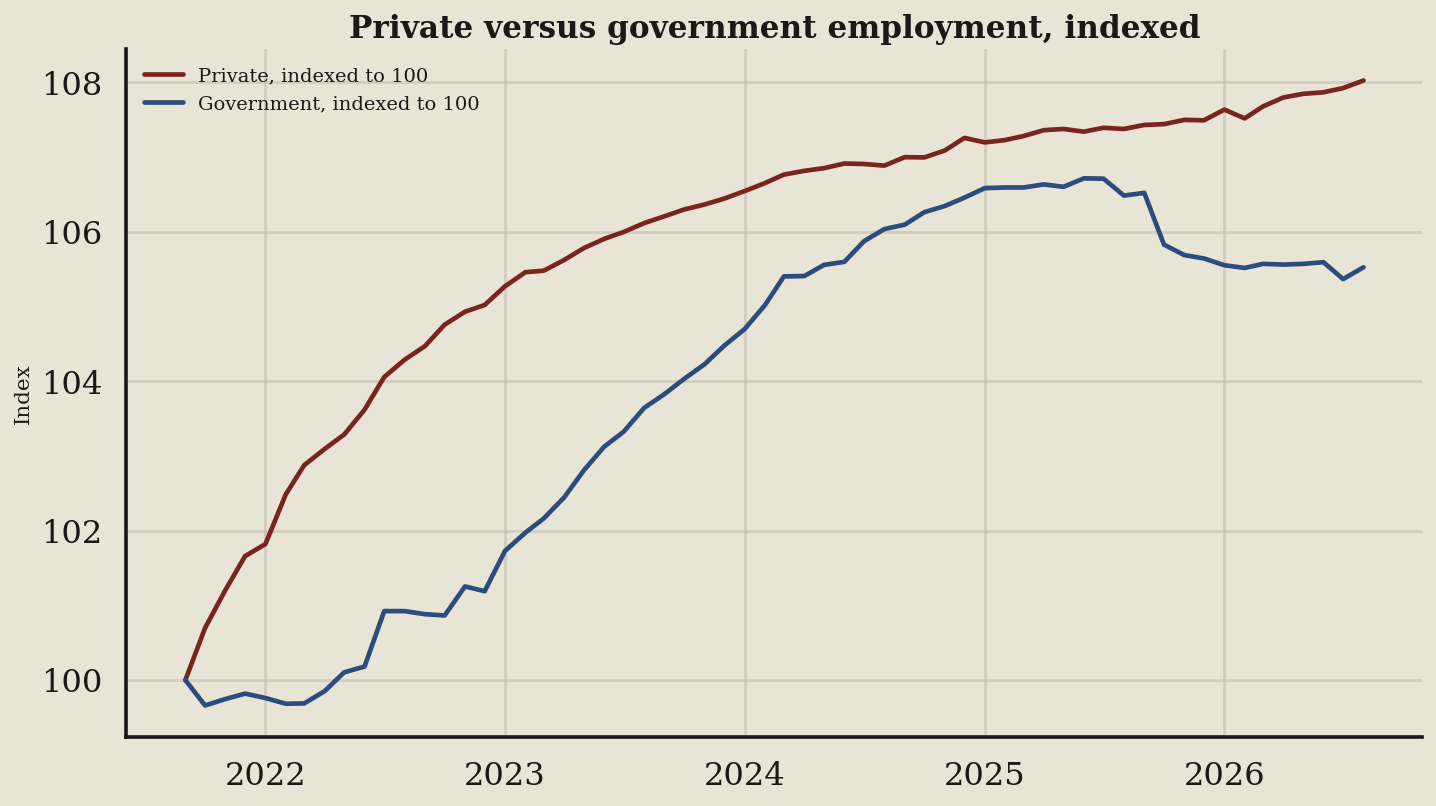
I pulled the August 2026 file for the Employment Situation report to verify where roles are actually opening. The chart below tracks 60 months of hiring, proving job seekers must follow specific budgets rather than broad national headlines.
Key takeaways
- The dark red line for private payrolls moved roughly flat at 108 over the last four readings, meaning corporate hiring paused.
- That private index peaked at its high of 108 in August 2026, leaving 135,752 jobs for active corporate applicants.
- The blue line for government payrolls held roughly flat at 106 over the last four readings, signaling frozen public budgets.
- That government index hit a high of 107 in June 2025, meaning public sector applicants missed the best hiring wave.
What the terms mean
- Payrolls: The total count of active worker roles shown in the Current Employment Statistics program.
- Index: A calculation that sets the September 2021 start to 100 so readers can compare differing totals directly.
- Private jobs: Roles at private companies, officially measured by the All Employees, Total Private series.
- Government jobs: Public sector positions, officially measured by the All Employees, Government series.
What to watch next
A government-education swing can fake a national stall, so monitor the U.S. Economy at a Glance page before shifting your target.