Retail margins
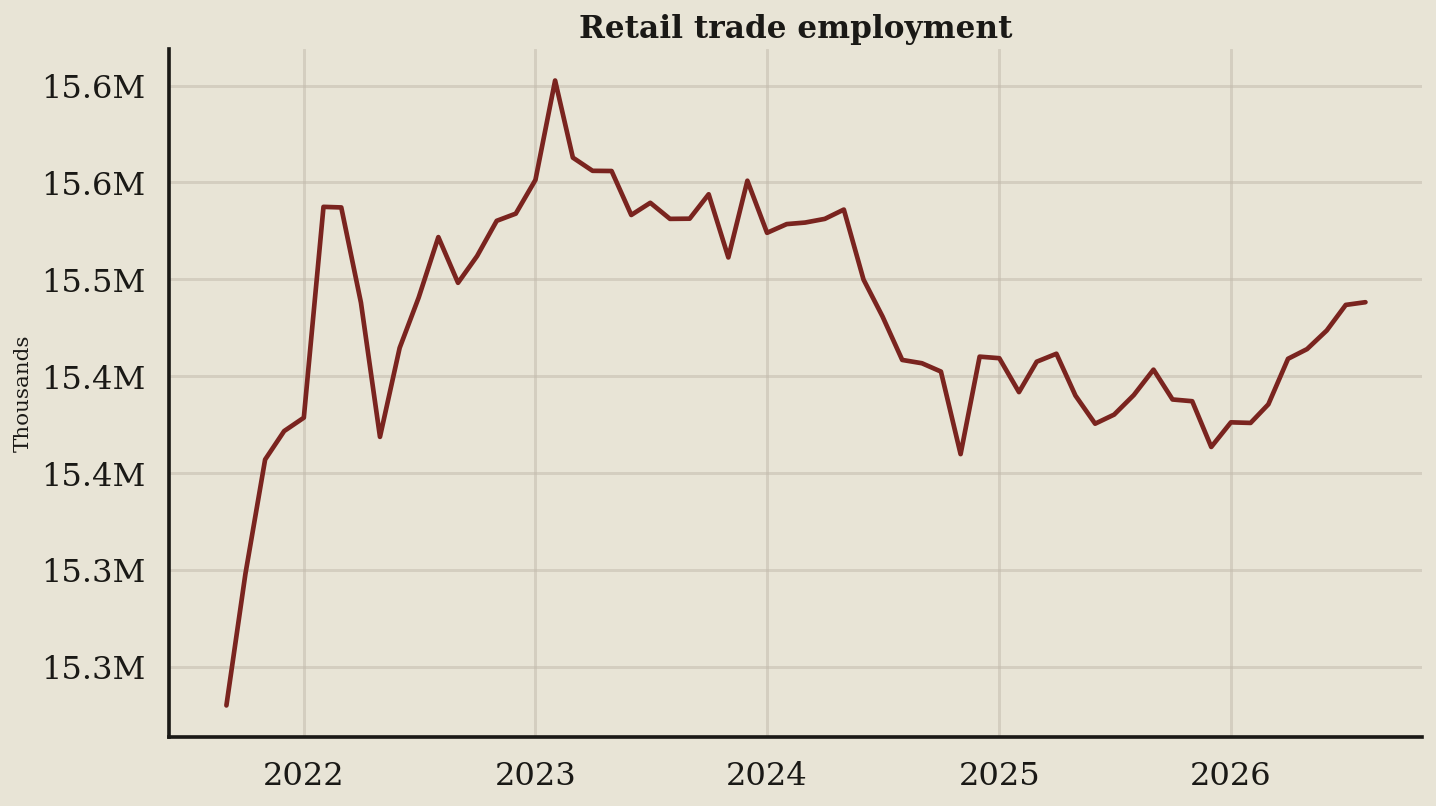
I pulled the Employment Situation news release to track sixty months of retail trade on a dark red line. While vendors profit from selling hope, the Current Employment Statistics program proves employers actually profit by squeezing schedules before paying new applicants.
Key takeaways
- Retail trade ended August 2026 up 1,400 to 15,488,200, meaning applicants face a stalled market.
- Retail trade climbed from a 15,280,000 low in September 2021, establishing a higher staffing baseline.
- The dark red line fell from a February 2023 peak of 15,603,000, signaling lost applicant leverage.
- The series moved up from 15,464,000 over the last four readings, offering a slight pulse.
What the terms mean
- The Employment Situation news release: The main federal report summarizing monthly job changes.
- The Current Employment Statistics program: A government survey tracking how many people businesses employ.
- Retail trade: A sector tracked on the Retail Trade statistics page counting storefront workers.
- Claims hold: A period when unemployment filings stay flat, showing no broad layoffs.
- U.S. Economy at a Glance: A federal dashboard monitoring basic labor market metrics.
What to watch next
A retail loss next to a claims hold on U.S. Economy at a Glance is an hours story, not a collapse story.