
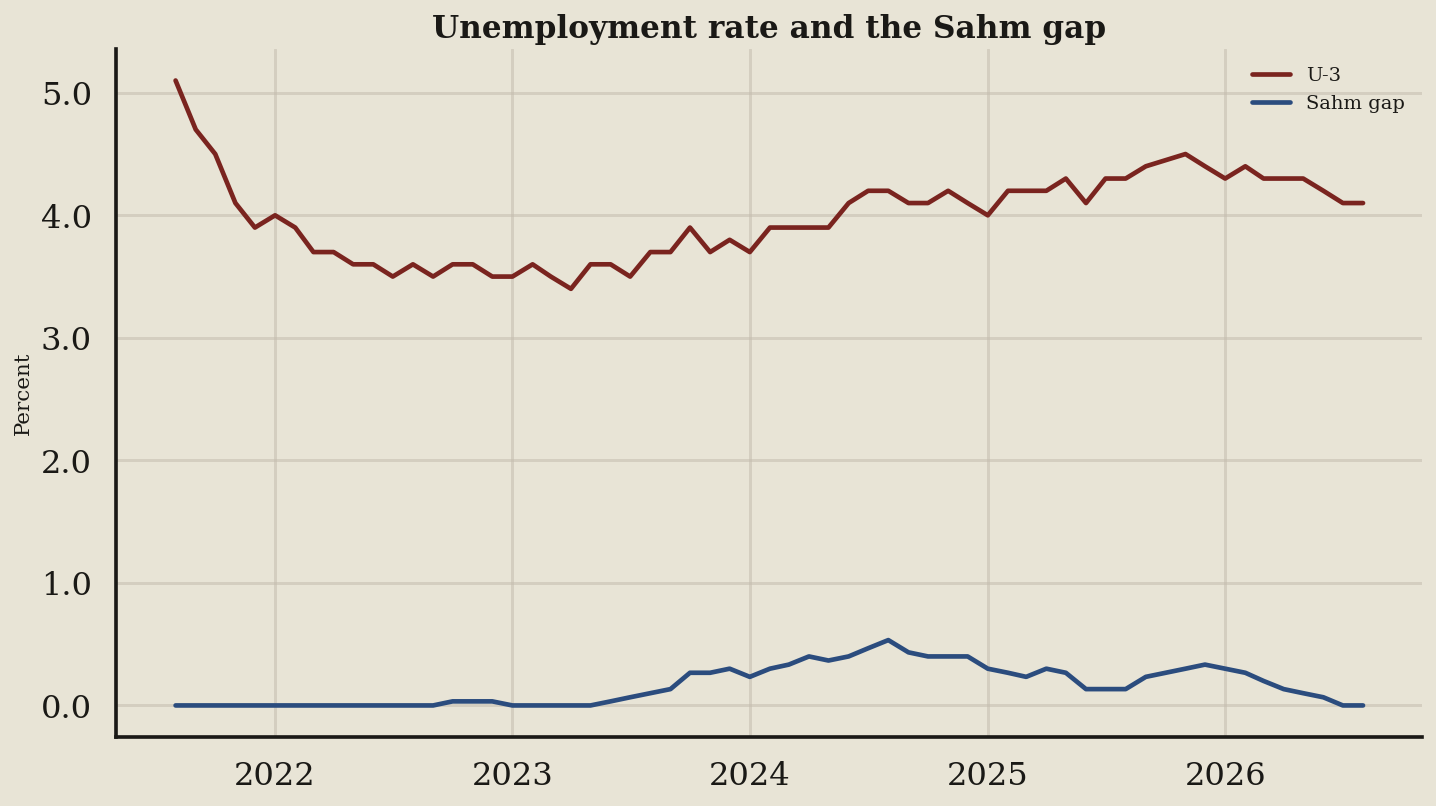
I pulled the August 2026 seasonally adjusted data, which removes predictable hiring swings, from the Employment Situation release. Panic only pays the resume writers. The chart plots U-3, the share of people actively seeking work, against those claims.
Key takeaways
- The dark red U-3 line tracks 60 monthly readings from August 2021 to August 2026, starting at a 5.1 high.
- U-3 hit a 3.4 low in April 2023. Its recent drop from 4.3 to 4.1 means employers are still hiring.
- The blue Sahm gap line, a recession rule of thumb tracking rapid unemployment spikes, starts at a 0 low.
- That blue line hit a 0.53 high in August 2024, showing that vendors selling a market collapse use stale data.
- The blue gap moved down from 0.1 to end at 0 over its last four readings, meaning you can ignore the panic.
What the terms mean
- Seasonally adjusted: A statistical filter on the U.S. Economy at a Glance page that removes expected hiring swings.
- U-3: The standard jobless metric derived from the Current Population Survey program, counting people actively seeking work.
- Sahm gap: A recession warning triggered by rising unemployment averages, calculated in the Sahm rule recession indicator series.
What to watch next
Watch whether the three-month average keeps climbing after the next print to see if the subplot becomes the main story.