The receipt on your search timeline
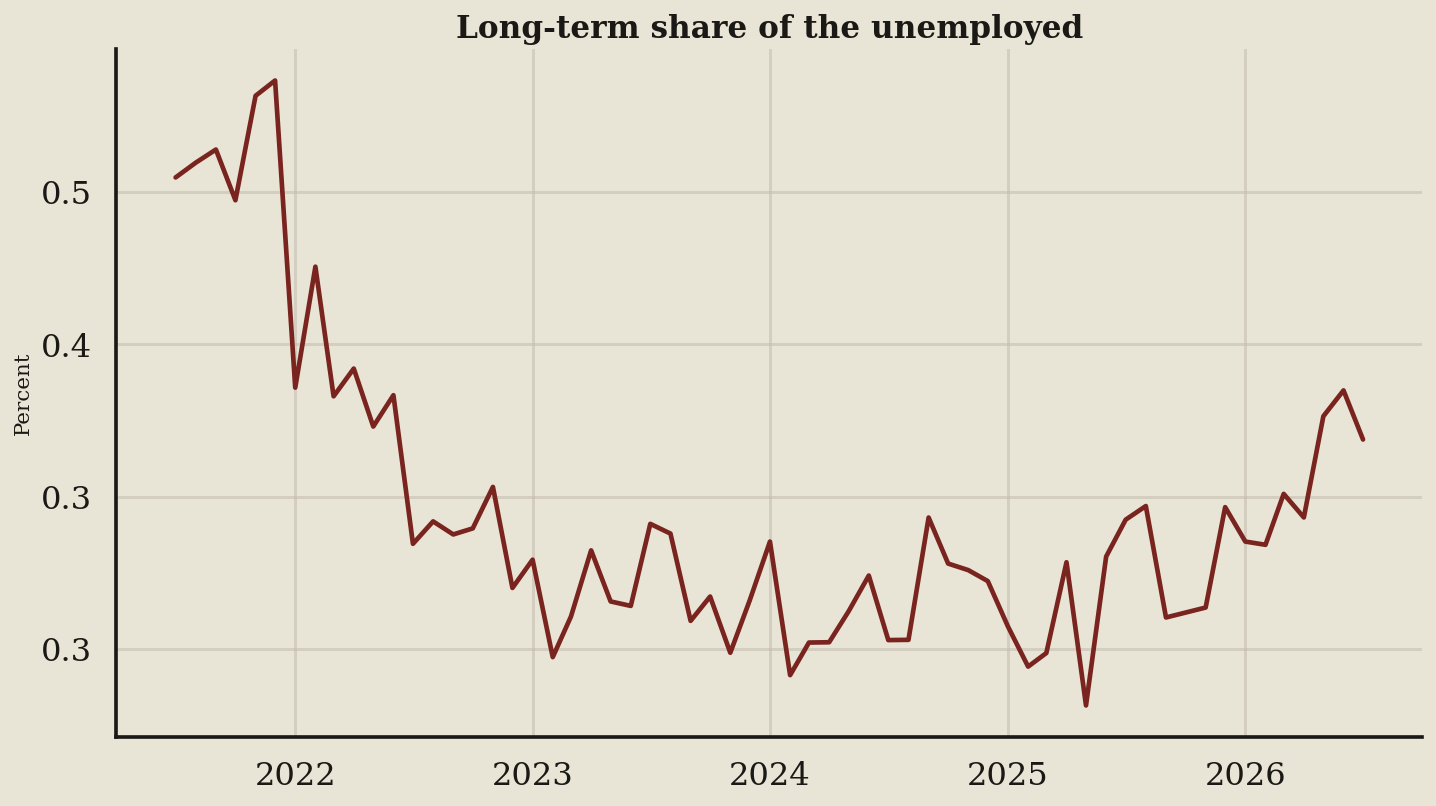
I pulled the Employment Situation news release, the monthly government jobs update, and the 60 plotted monthly readings from July 2021 to July 2026 show long-term unemployment, counting those jobless for 27 weeks or more, hitting a 0.369 share despite vendor promises of quick hires. Ask who profits from the fast-placement myth: employers save money by outwaiting desperate candidates for 25.5 weeks, dictating how you must budget your search.
Key takeaways
- The dark red line dropped from a 0.49 December 2021 high to 0.37, meaning immediate hiring is over.
- The share hit a 0.28 low in May 2025 before moving up, showing employers are regaining the leverage to wait.
- Over the last four readings, the share climbed from 0.34 to 0.37, signaling you need to protect your cash reserves.
What the terms mean
- The Employment Situation news release is the government document reporting national job gains and the jobless count.
- Long-term unemployment counts people who have been jobless and actively seeking work for 27 weeks or more.
- The headline rate is the primary percentage of the labor force that is unemployed and searching.
What to watch next
Watch the long-term share as a signal that the line is stacking, even if the headline rate, the main jobless percentage, barely moves.