The July 2026 jobless picture
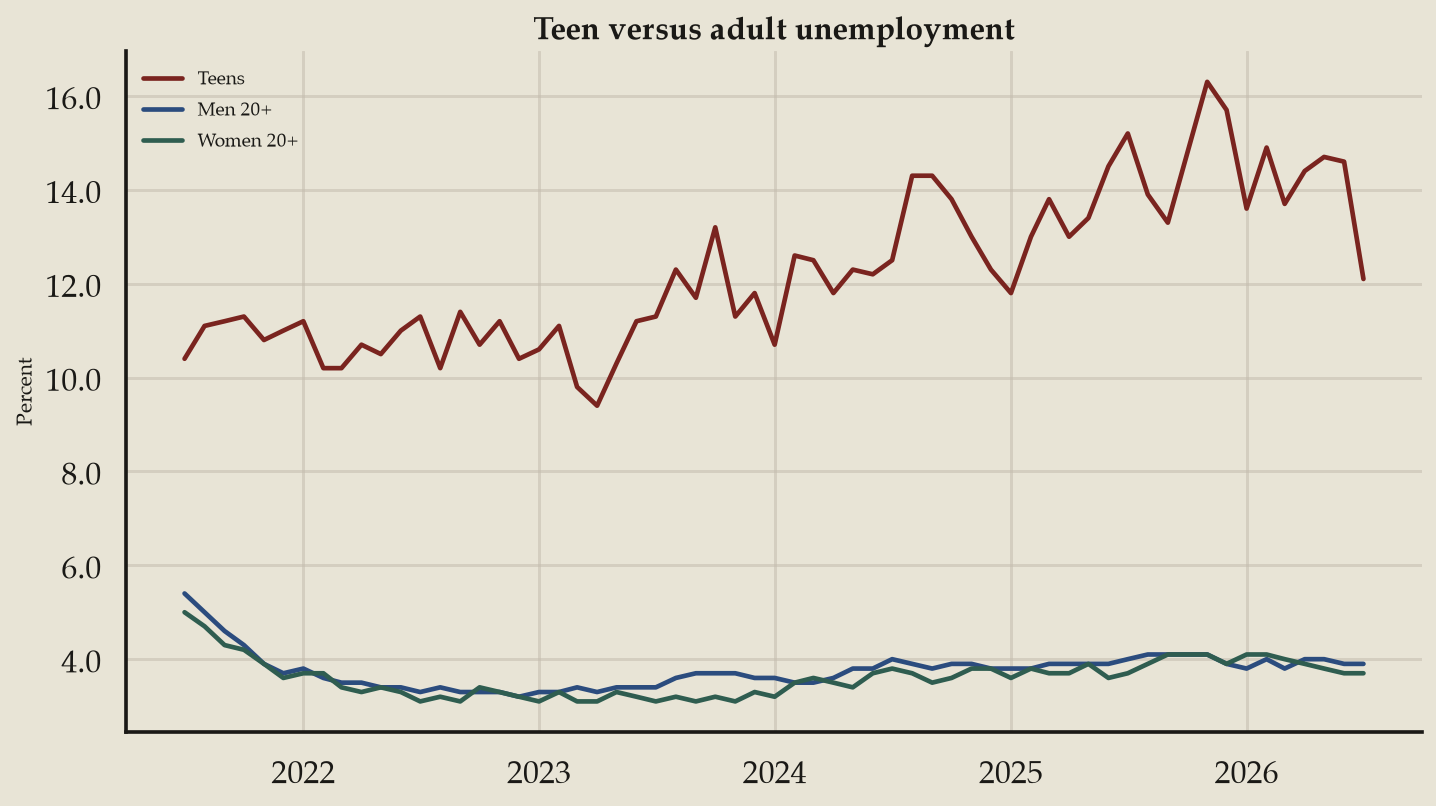
I pulled the July 2026 numbers from the Employment Situation news release, scanning the national dashboard and the employer payroll totals to see who profits from the optimistic narrative. The chart, sourced from the Current Population Survey household poll, proves teen unemployment moved down for seasonal employers, but flat adult rates leave career seekers stranded.
Key takeaways
- Teens dropped: The dark red line moved down from 14.4 to 12.1 percent over four readings, meaning seasonal work absorbed applicants.
- Men held flat: The blue line (men 20+) moved down from 4 to 3.9 percent over four readings, showing scarce career openings.
- Women barely shifted: The green line (women 20+) moved down from 3.9 to 3.7 percent over four readings, confirming employers are waiting.
What the terms mean
- Unemployment: The share of the labor force actively looking for work but unable to find a job.
- The Employment Situation news release: The monthly government report measuring national hiring.
- The Current Population Survey: The household poll asking individuals if they are working to generate the chart.
What to watch next
A teen drop with flat adult rates is not a broad thaw, so watch the adult lines for actual hiring movement.